programming4biologists
Everything you need to get started for the course "Programming in C++ for Biologists".
Using Visual Studio Code
- Required files
- Required extensions
- Checking everything is installed correctly
- Debugging
- Working on each chapter
Required files
Visual Studio Code (VSC) works by opening a folder and operating on the files inside that folder.
In such folder, VSC requires a C++ file, typically called main.cpp, and a CMakeLists.txt file, which indicates how the C++ file needs to be compiled.
The easiest way to set up a correct folder is by downloading these files here:
Normally, if you followed all the instructions for Getting Started, you should already have these two files in a folder named cmake-project.
In case you do not already have these files:
- Download them by right-clicking on them and choosing Save As.
- Place them in a new empty folder in which you want to work.
Alternatively, you can:
- Download both jointly as a zip
 folder.
 - Unzip the folder wherever you like on your machine.
Every time you start a new programming project, you can repeat this and copy these files into a new folder.
Required extensions
If they haven’t been installed while Getting Started, you need to install the following extensions to make VSC work:
ms-vscode.cpptools(C/C++)ms-vscode.cmake-tools(CMake Tools)
Install these by navigating to the left-hand side menu. Click on the Extensions symbol  .
There, look for and install the extensions.
.
There, look for and install the extensions.
Checking everything is installed correctly
With our files downloaded and extensions installed, we can now use VSC to open our working folder.
- In VSC, choose File, Open Folder… and open your folder.
- If asked, select Yes, I trust these authors.
- VSC will now show a drop down menu where you are to select your Kit. A Kit is the underlying compiler used by VSC. You can pick your favourite here, or pick ‘unspecified’ if you don’t know, both work fine. If the kit selection menu disappeared (because you navigated back to this webpage for instance), you can make it reappear by pressing CTRL+SHIFT+P (CMD+SHIFT+P on macOs). Your VSC will now look similar to this:
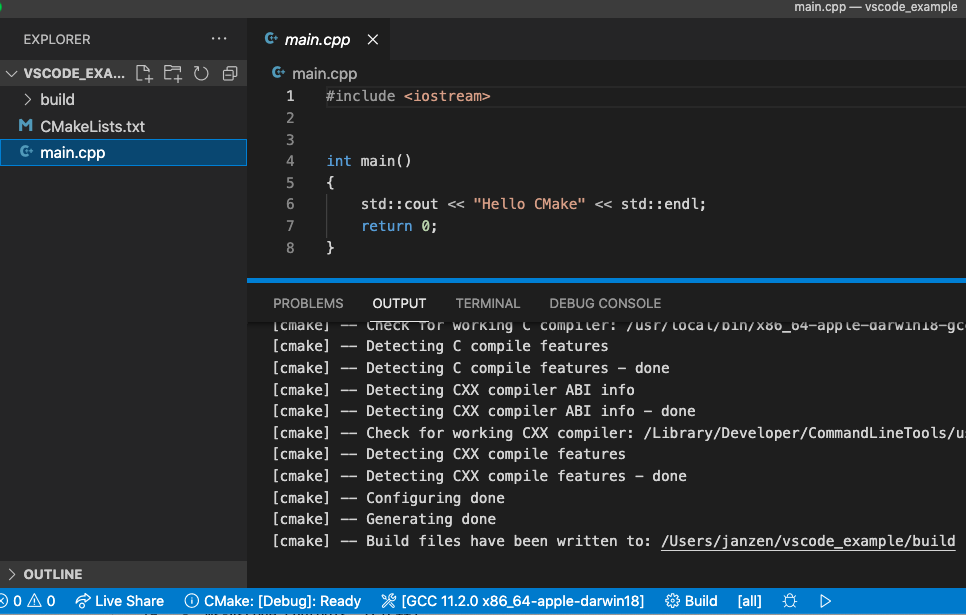 With the buttons Build
  , Debug
  and Run
  at the bottom.
 - Press the play icon to execute your code, and it will display
Hello CMakein the terminal panel. - Congratulations, you just compiled, built and ran your C++ program!
If the buttons are not available, this indicates that you are missing the CMake Tools extension. Please see the section above to install this.
Debugging
An important tool in programming is to be able to break your program at a specific line, and execute the program step-by-step. Depending on the lecture track you choose, you might learn to do this during the course.
- In Visual Studio Code, click left of line 6 in your code to create a bright red dot next to the line. This indicates that we want to pause our program at this location.
- Select the Run and Debug menu on the left, indicated by the play icon with a small bug in front of it.
- There, click on the Run and Debug bar.
- Visual Studio Code will ask you what environment to choose. Choose the environment appropriate for your operating system.
- Visual Studio Code will give an error, and ask you to create a
launch.jsonfile. Click on create launch.json file to do so. This will open a newlaunch.jsonfile in VSC. - Change the entry at
program, to make sure that it points towards your executable. The location of that executable may vary depending on your operating system. The best way to find out is to press the ‘play’ button. This will show you the location of your executable: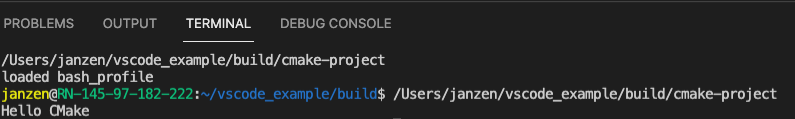
- Copy that link (in this case, /Users/janzen/vscode_example/build/cmake-project, where
cmake-projectis our executable. On Windows, you can expect something like C:\vscode_example\build\Debug\cmake-project.exe). - Paste it in the right position in your
launch.jsonfile.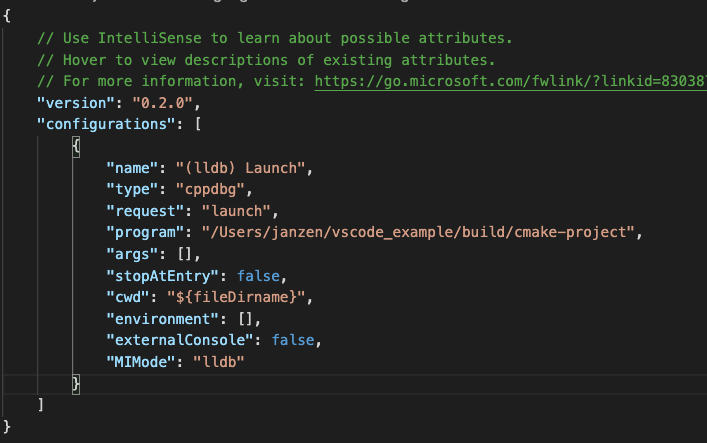
- Run the program in Debug mode by pressing F5 (there is no button in the program, only F5 works).
- The program stops at line 6, which you marked with a breakpoint (the little red dot to the left of the line). Well done, you’re now ready to debug!
Debugger errors on Linux
You might encounter some errors while setting up the debugger. To fix them, follow the steps below.
Unable to start debugging
If this error pops up in Visual Studio Code:
Unable to start debugging : The value of miDebuggerPath is invalid
You want to use gdb as your debugger. Make sure you have it installed, and find its path with the command which -a gdb in the terminal window. Copy the local path (probably something like /usr/bin/gdb) into your launch.json file, and update the relevant values like so:
"MIMode": "gdb",
"miDebuggerPath": "/usr/bin/gdb"
Failed to set controlling terminal
If you get this error in Visual Studio Code’s debugging terminal:
warning: GDB: Failed to set controlling terminal: Operation not permitted
This is a common bug with gdb when it is not up-to-date. You will need to manually install the most updated stable version of gdb:
- Go to the gdb download portal.
- Right-click on the most recent .xz file and copy the link. As of November 9, 2021, this would be
https://ftp.gnu.org/gnu/gdb/gdb-11.1.tar.xz - Open your terminal, type
wgetand paste the link to the target file (example,wget https://ftp.gnu.org/gnu/gdb/gdb-11.1.tar.xz). Enter. - Unzip the file with the
tar -xfcommand (example,tar -xf gdb-11.1.tar.xz). - Move to the new directory
cd gdb-11.1/. ./configure.make. If at this stage, you get the following error:configure: error: GMP is missing or unusable, fix it as per the instructions below, then try again and resume to step 8.- Copy the program to your local bin
sudo cp gdb/gdb /usr/local/bin/gdb. - Verify that gdb is correctly updated:
gdb --versionshould show the correct version number (11.1in this example).
GMP is missing or unusable
If you get this error while installing gdb with make:
sudo apt install libgmp-dev- Run
makeagain. It should complete without error this time. - Go back to step 8 above and complete the instructions.
Working on each chapter
A suggested way to organise your files involves splitting each chapter in a separate folder.
- Make a copy the
hello_worldfolder in theprojects/folder. - Rename it to something of your choice, for example
chapter1. - Open VS Code as described in the installation section above and repeat the
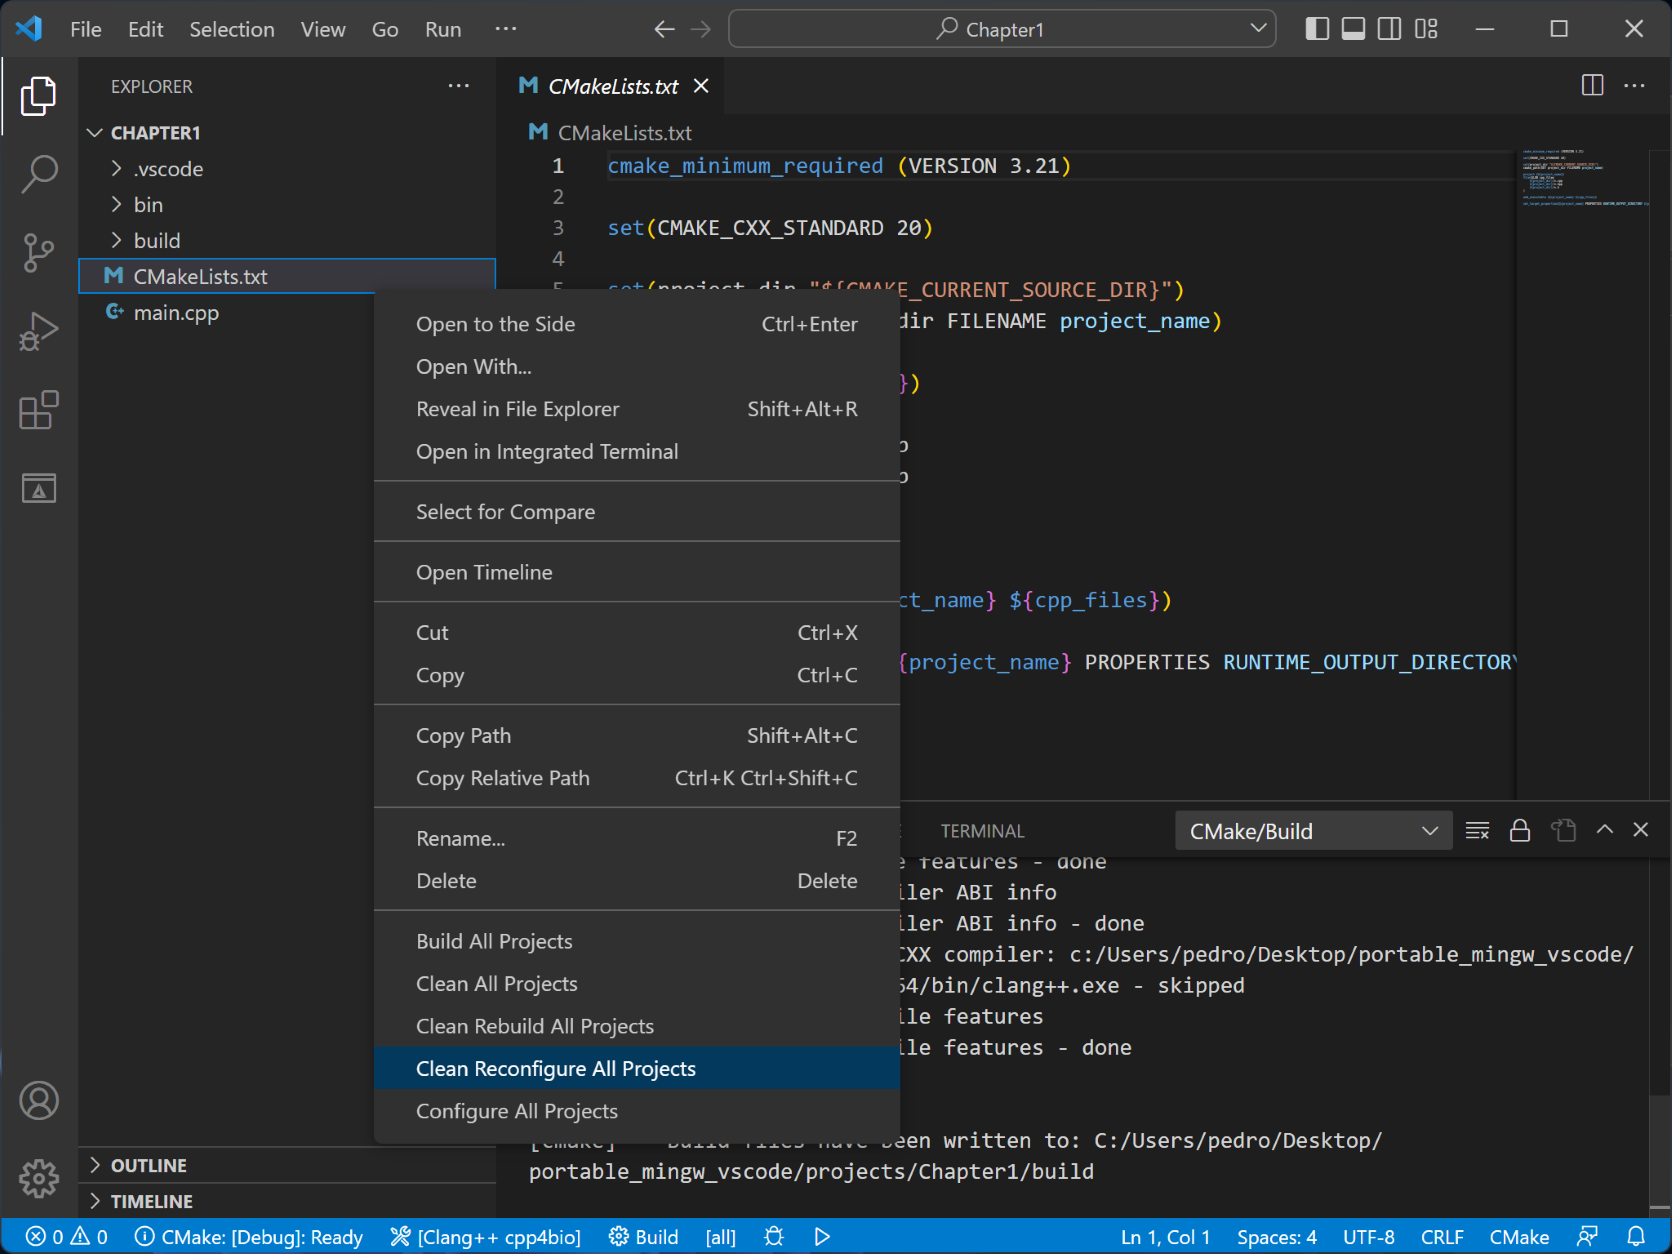
Open folderstep. This time, select your new folder. - It is possible that the contents you copied over contain some lingering folder specific files. To set things up properly, right click on the CMakeLists from within VS Code and choose Clean Reconfigure All Projects.
- You should now be able to build and run the code in your new folder.
